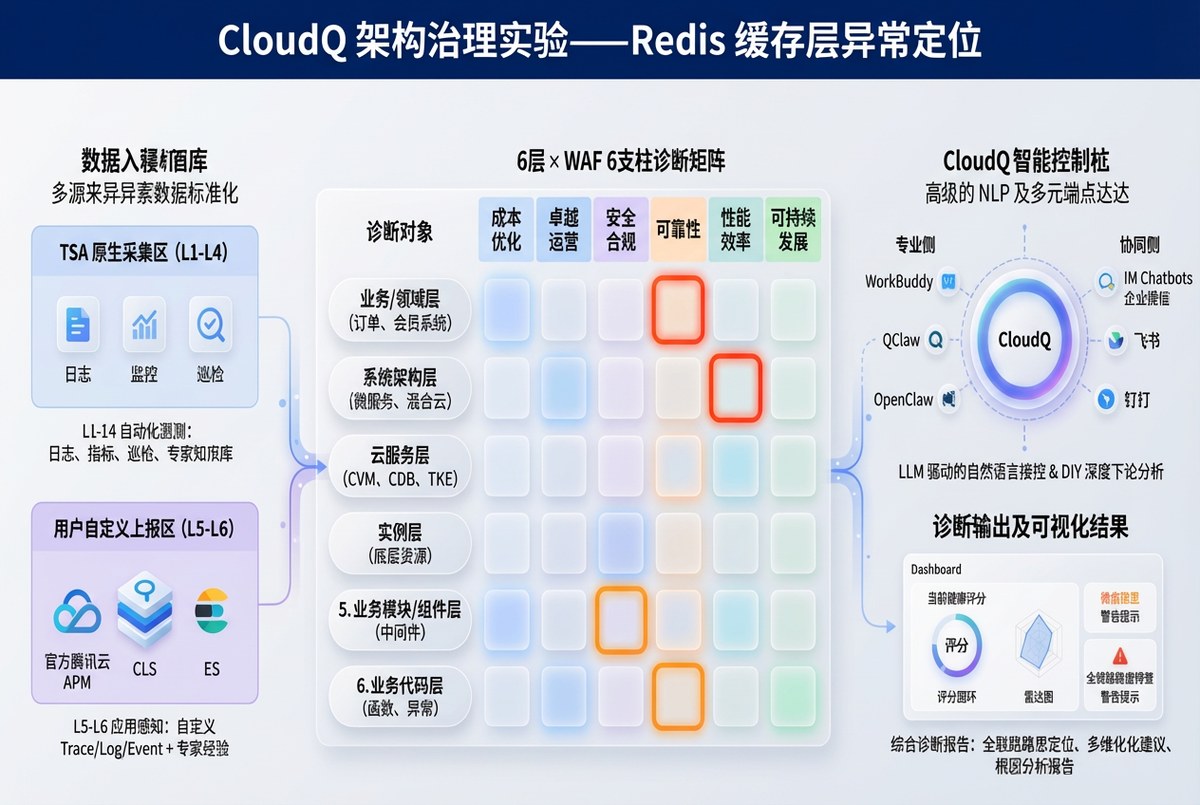
图:基于诊断矩阵的实验覆盖维度 — 缓存层 x 可靠性/性能效率,应用层 x 可靠性/卓越运营
一、实验概述
本文是 《腾讯云智能顾问(TSA)架构评估实战》 计划的第一轮架构治理实验报告,完整记录了 Redis 缓存层故障注入的全过程。实验通过智能顾问 CloudQ 的 CLS 日志分析与架构评估双重能力验证故障检测效果。
| 实验目标 | 验证智能顾问 CloudQ 能否通过架构评估和 CLS 日志分析检测到 Redis 连接故障 |
| 故障类型 | Redis 连接地址错误(模拟配置变更导致的缓存不可达) |
| 影响层次 | 缓存层(Redis) → 应用层(Node.js) |
| 涉及支柱 | 可靠性、性能效率、卓越运营 |
| 实验时间 | 2026-04-03 21:43 ~ 21:57(CST) |
| 实验结果 | 智能顾问 CloudQ 成功检测到故障,精准定位到 Redis 连接超时 |
二、诊断矩阵定位
本次实验在诊断矩阵中覆盖了以下维度:
| 架构层 | 可靠性 | 性能效率 | 卓越运营 |
|---|---|---|---|
| 缓存层 (Redis) | ■ 命中 连接超时导致缓存完全不可用 | ■ 命中 所有请求穿透到 MySQL | — |
| 应用层 (Node.js) | ■ 命中 首页 >30s 超时完全不可用 | — | ■ 命中 健康检查未覆盖 Redis 依赖 |
三、Step 1 — 备份目标文件
$ cp /opt/tech-blog/config/index.js /opt/tech-blog/config/index.js.bak
$ cp /opt/tech-blog/models/article.js /opt/tech-blog/models/article.js.bak
$ cp /opt/tech-blog/routes/index.js /opt/tech-blog/routes/index.js.bak

Backups created:
-rw-r--r-- 1 root root  397 Apr  3 18:34 config/index.js.bak
-rw-r--r-- 1 root root 1950 Apr  3 18:34 models/article.js.bak
-rw-r--r-- 1 root root 2113 Apr  3 18:34 routes/index.js.bak
四、Step 2 — 采集基线数据
4.1 服务基线
=== [2026-04-03 21:43:49] Baseline Health Check ===
$ curl -s -w '\nResponse Time: %{time_total}s' http://localhost/health
{"status":"ok","timestamp":"2026-04-03T13:43:49.497Z"}
Response Time: 0.001018s

=== Baseline Homepage ===
$ curl -s -o /dev/null -w 'Time: %{time_total}s, Size: %{size_download}B, Status: %{http_code}' http://localhost/
Response Time: 0.002699s, Size: 9087 bytes, Status: 200
4.2 智能顾问 CloudQ 日志基线
输入:
智能顾问 CloudQ: "上海地域,搜索shweb日志主题最近10分钟的ERROR日志"输出:
时间范围:21:34:43 ~ 21:44:43 | 命中:3 条
全部为 Nginx 静态资源 404(图片文件),无 Redis 连接错误。
| 时间 | 错误 | 缺失文件 |
|---|---|---|
| 21:42:37 | No such file or directory | fault-comparison.jpg |
| 21:42:37 | No such file or directory | architecture-diagram.jpg |
| 21:42:37 | No such file or directory | dual-detection.jpg |
基线结论:当前 ERROR 日志均为图片 404(已知问题),无 Redis 连接错误。
五、Step 3 — 注入 Redis 故障
5.1 代码变更
文件:/opt/tech-blog/config/index.js

// 修改前
redis: {
  host: '172.17.0.14',   // 正确地址
  port: 6379
}

// 修改后(注入故障)
redis: {
  host: '172.17.0.199',  // 不存在的地址
  port: 6379
}
5.2 重启并验证
[2026-04-03 21:51:15] Restarting service with faulty Redis config...
$ systemctl restart tech-blog

=== Health Check(故障注入后)===
$ curl -s -w '\nTime: %{time_total}s' http://localhost/health
{"status":"ok","timestamp":"2026-04-03T13:51:20.975Z"}
Time: 0.003891s  ✅ 健康检查正常(不依赖 Redis)

=== Homepage(故障注入后)===
$ curl -s -o /dev/null -w 'Time: %{time_total}s, Status: %{http_code}' --max-time 30 http://localhost/
Time: 30.002490s, Status: 000  ❌ 首页 30 秒超时!

=== 应用日志 ===
$ tail -8 /opt/tech-blog/logs/app.log
2026-04-03T13:51:16.581Z [INFO]  Server running on port 3000
2026-04-03T13:51:26.583Z [ERROR] Redis connection error: connect ETIMEDOUT
2026-04-03T13:51:36.786Z [ERROR] Redis connection error: connect ETIMEDOUT
2026-04-03T13:51:47.189Z [ERROR] Redis connection error: connect ETIMEDOUT
2026-04-03T13:51:57.790Z [ERROR] Redis connection error: connect ETIMEDOUT
2026-04-03T13:52:08.594Z [ERROR] Redis connection error: connect ETIMEDOUT
2026-04-03T13:52:19.596Z [ERROR] Redis connection error: connect ETIMEDOUT
2026-04-03T13:52:30.799Z [ERROR] Redis connection error: connect ETIMEDOUT
六、Step 4 — 智能顾问 CloudQ 故障检测
等待约 2 分钟(让错误日志进入 CLS)后,使用智能顾问 CloudQ 进行日志分析。
6.1 CLS 日志分析
输入:
智能顾问 CloudQ: "上海地域,搜索shweb日志主题最近10分钟包含ETIMEDOUT或Redis的ERROR日志"输出(智能顾问 CloudQ 完整响应):
智能顾问 CloudQ 日志检索结果
| 地域 | 上海(ap-shanghai) |
| 日志主题 | shweb |
| 时间范围 | 21:46 ~ 21:56(最近 10 分钟) |
| 检索条件 | (ETIMEDOUT OR Redis) AND ERROR |
| 命中数量 | 20 条(已达上限,仍有更多未展示) |
智能顾问 CloudQ 错误模式分析
所有 20 条日志均为同一类错误,以约 12 秒间隔持续报错:
| 时间 | 级别 | 错误信息 | 来源主机 |
|---|---|---|---|
| 21:55:57 | ERROR | Redis connection error: connect ETIMEDOUT | 172.17.0.6 |
| 21:55:42 | ERROR | Redis connection error: connect ETIMEDOUT | 172.17.0.6 |
| 21:55:28 | ERROR | Redis connection error: connect ETIMEDOUT | 172.17.0.6 |
| ... 共 20 条,约每 12 秒一次 ... | |||
| 21:51:57 | ERROR | Redis connection error: connect ETIMEDOUT | 172.17.0.6 |
智能顾问 CloudQ 问题判断
| 错误类型 | Redis 连接超时(connect ETIMEDOUT) |
| 严重程度 | 严重 — 10 分钟内持续报错,未自愈 |
| 影响范围 | 172.17.0.6 上的 tech-blog 应用 |
| 根因方向 | Redis 实例不可达(宕机/网络不通/安全组/连接数满) |
智能顾问 CloudQ 排查建议
- 检查 Redis 实例状态 — 确认是否正常运行
- 检查网络连通性 — 从 172.17.0.6 到 Redis 的网络是否通畅
- 检查 Redis 连接数 — 是否达到上限
- 检查 Redis 内存/CPU — 是否因资源耗尽导致无法响应
6.2 架构评估基线对比
基线评估总分 82/100,其中性能支柱 100 分。由于 Redis 连接故障发生在应用配置层面(配置指向了错误的 IP),云资源本身(Redis 实例)仍然正常运行,因此架构评估的云资源维度评分不会立即变化。这也揭示了两种检测方式的互补关系:
- 架构评估:检测"云资源是否配置合理" → Redis 实例本身健康 → 评分不变
- 日志分析:检测"应用运行是否正常" → 大量 ETIMEDOUT 错误 → 精确定位故障
- 互补结论:架构评估说"基础设施没问题",日志分析说"但应用连不上 Redis" → 定位到配置错误
七、Step 5 — 回滚恢复
[2026-04-03 21:57:38] Rollback & Recovery

$ cp /opt/tech-blog/config/index.js.bak /opt/tech-blog/config/index.js
$ systemctl restart tech-blog

=== Recovery Verification ===
$ curl -s -w '\nTime: %{time_total}s' http://localhost/health
{"status":"ok","timestamp":"2026-04-03T13:57:38.212Z"}
Time: 0.001891s  ✅

$ curl -s -o /dev/null -w 'Time: %{time_total}s, Status: %{http_code}' http://localhost/
Time: 0.003003s, Status: 200  ✅

服务完全恢复。
八、实验结果总结
8.1 全流程数据对比
| 指标 | 基线 | 故障期间 | 恢复后 |
|---|---|---|---|
| 健康检查 | 0.001s ✅ | 0.004s ✅ | 0.002s ✅ |
| 首页响应 | 0.003s ✅ | >30s ❌ | 0.003s ✅ |
| HTTP 状态码 | 200 | 超时(000) | 200 |
| Redis 错误日志 | 0 条 | 20+ 条 | 0 条 |
| 智能顾问 CloudQ 日志检测 | 无 Redis 异常 | 检测到 ETIMEDOUT | — |
| 架构评估总分 | 82/100 | 82/100(云资源层不变) | 82/100 |
8.2 智能顾问 CloudQ 检测能力评估
| 检测维度 | 是否检测到 | 详情 |
|---|---|---|
| CLS 日志分析 | ✅ 是 | 精准检测到 Redis connection error: connect ETIMEDOUT,识别出报错频率(12秒/次)、影响主机、持续时间,给出 4 条排查建议 |
| 架构评估 | ⚠️ 部分 | Redis 实例本身正常运行,评分不变。但基线已发现 Redis 安全风险(未禁用高危命令) |
8.3 关键发现
- CLS 日志分析是检测应用层故障的利器:智能顾问 CloudQ 在 10 分钟窗口内检索到 20+ 条 Redis 连接错误,精准区分 ETIMEDOUT(网络层超时)与 ECONNREFUSED(服务层拒绝)的差异
- 架构评估与日志分析视角互补:架构评估检测"云资源是否健康",日志分析检测"应用运行是否正常"。配置错误导致的故障更适合日志分析来发现
- 故障影响超出预期:Redis 连接超时导致首页完全不可用(>30s),而非预期的"响应变慢"。原因是 ioredis 的 retryStrategy 在连接失败时持续重试,阻塞了 cache.get() 调用
- 健康检查存在盲区:/health 端点不依赖 Redis,因此在服务完全不可用时仍返回 200,提示需要将关键依赖项纳入健康检查
8.4 架构治理建议
- 健康检查应包含 Redis 连通性探测:在 /health 端点中增加 Redis ping 检查
- Redis 连接增加超时配置:设置 connectTimeout 参数,避免长时间阻塞请求
- 实现缓存降级策略:当 Redis 不可用时跳过缓存直接查询数据库,而非阻塞等待
- 定期运行 智能顾问 CloudQ 双维度巡检:将架构评估 + CLS 日志巡检纳入日常运维流程